Handicapping the Statistical Report VII
Posted: Mon Mar 28, 2011 3:12 am
Here it is almost April, and the weather still feels like February, at least here in the northeast. (Stupid groundhog!) But regardless of spring's lack of springiness, it's time to peer into the crystal spreadsheet and take a shot at predicting the figures that will be reported this Saturday with General Conference's annual statistical report.
The first year I did this (2004), I posted my predictions at ZLMB. The next year, I posted them at the MAD board. The Wayback Machine archived 2005 for me, but all the subsequent years, up to and including last year, have been plowed under by MAD's latest incarnation, and archive.org never caught them. Therefore, I have come here hoping that this annual rite will have a more durable online presence.
My methodology is to calculate a projection by taking the previous five years' results for a particular statistic and seeing what the next year's value would be by linear projection. Then I eyeball it and decide whether that projection is likely to be high or low. For example:
Stakes
2005: 2,701
2006: 2,745
2007: 2,790
2008: 2,818
2009: 2,865
2010: 2,904 (five-year linear projection)
This projection can be calculated in Excel by using the TREND function. If the years 2005–2009 are in cells A1 through A5 and the stake totals are in cells B1 through B5, the 2010 projection can be calculated with this formula: TREND(B1:B5, A1:A5, 2010).
Here are the reported stake totals since 1973:
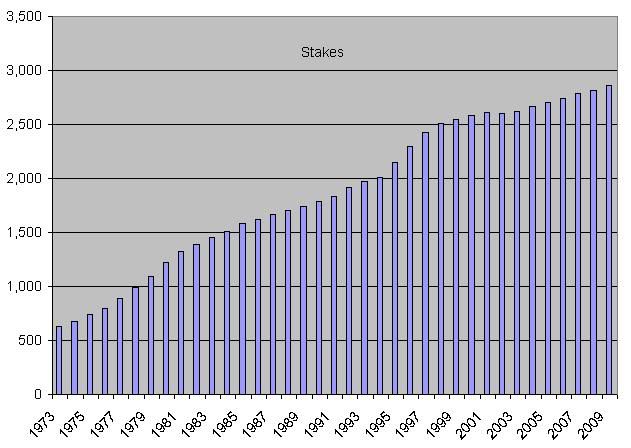
Last year stakes had, by a slim margin, their strongest year since the late 1990s. However, since the previous year was weaker than usual, I'm betting that the projection will be just a hair on the high side.
Predicted number of stakes for 2010: 2,903 (an increase of 38).
___________________________________________________________
Missions
2005: 341
2006: 344
2007: 348
2008: 348
2009: 344
2010: 348 (projected)
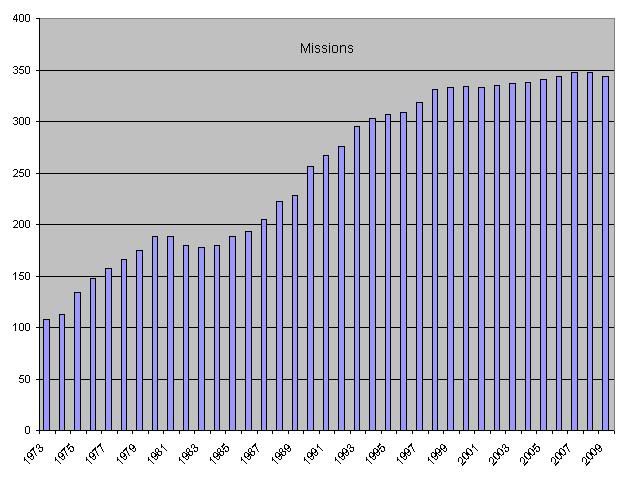
Last year the number of missions declined for the first time in eight years. I have the impression that the Church has been doing some global re-prioritizing of missionary resources recently, and I wouldn't be surprised if there's another decline in the offing. (Of course, I could have just paid attention to the Church News over the past year, but where's the fun in that?) In any case, I'm guessing the projection is high.
Predicted number of missions for 2010: 343 (a decrease of one).
___________________________________________________________
Districts
2005: 643
2006: 630
2007: 618
2008: 622
2009: 616
2010: 607 (projected)
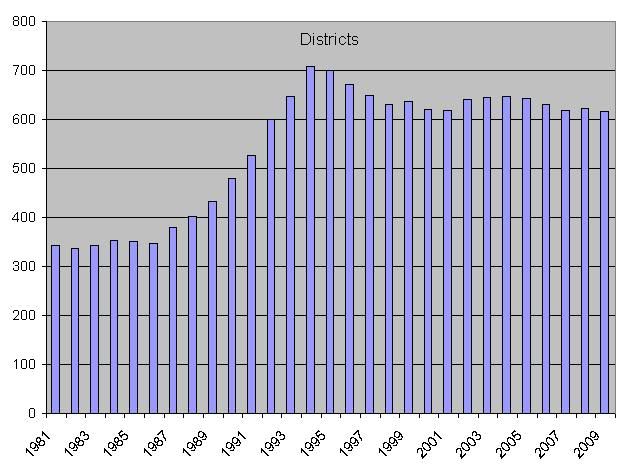
Districts have mainly been declining for the last five years. I'm guessing that will continue, but not by as much as projected.
Predicted number of districts for 2010: 613 (a decrease of three).
___________________________________________________________
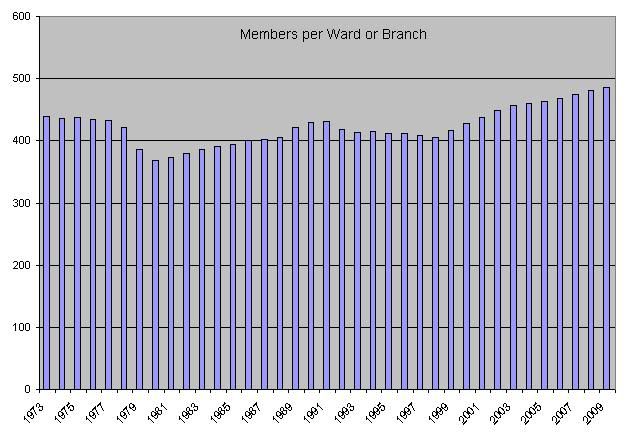
Wards and Branches
2005: 27,087
2006: 27,475
2007: 27,827
2008: 28,109
2009: 28,424
2010: 28,777 (projection)
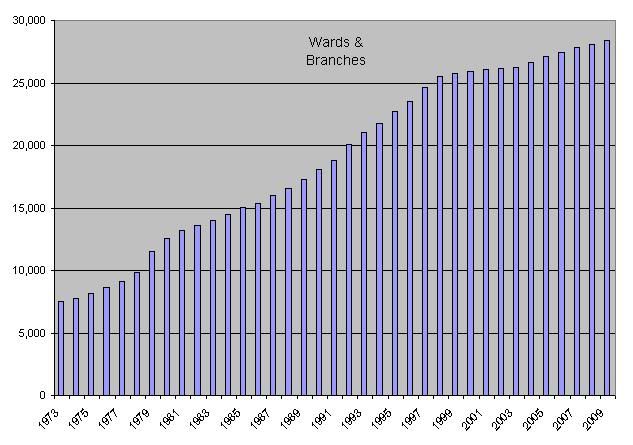
Wards and branches have been increasing by about 1% to 1.5% a year. The projection is right about in the middle of that range, which I think is about right. Forced to pick a side, though, I'll say that the projection is high.
Predicted number of wards and branches for 2010: 28,763 (an increase of 339).
___________________________________________________________
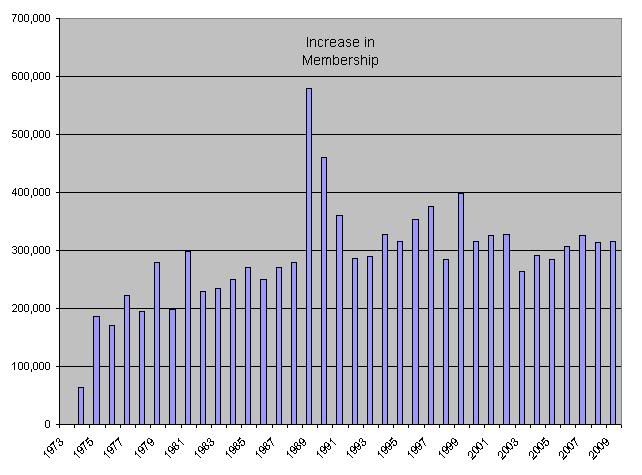
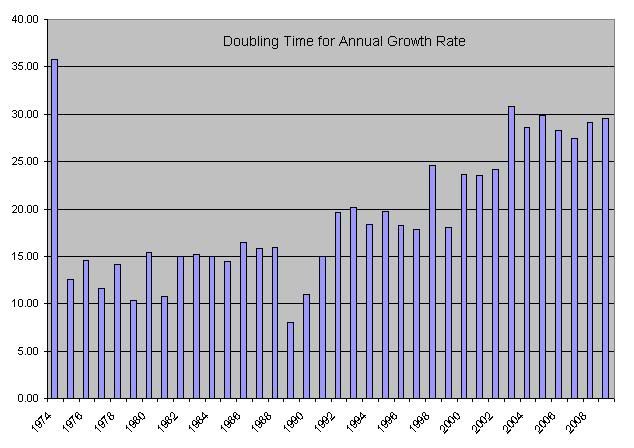
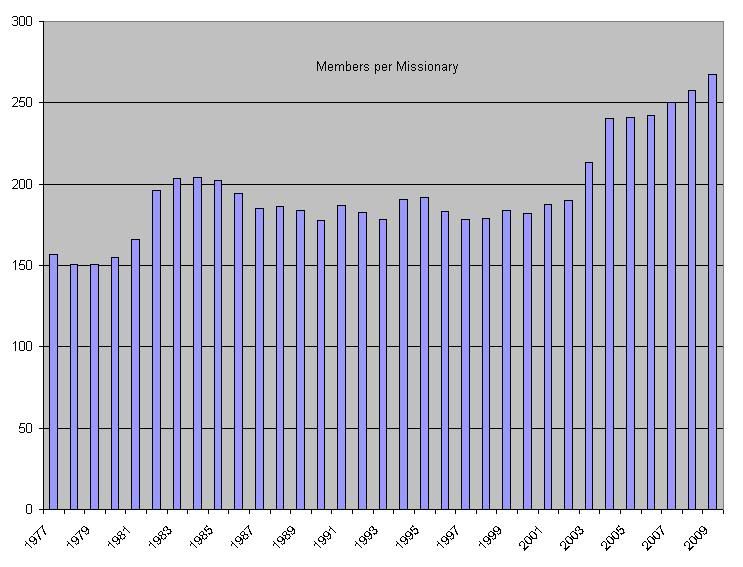
Total Membership
2005: 12,560,869
2006: 12,868,606
2007: 13,193,999
2008: 13,508,509
2009: 13,824,854
2010: 14,141,729 (projected: linear)
2010: 14,156,268 (projected: parabolic)
2010: 14,169,235 (projected: exponential)
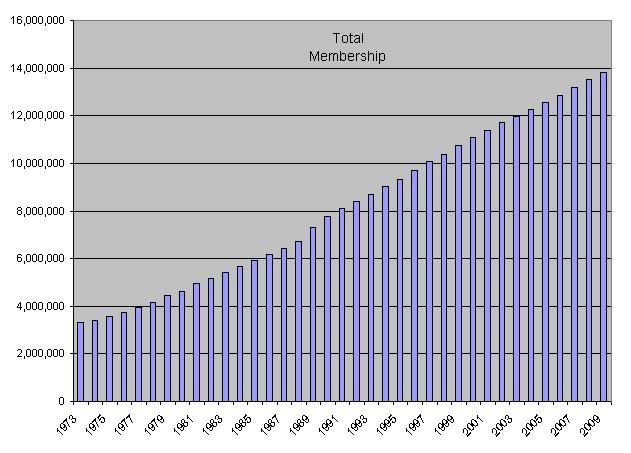
This is the largest and therefore least volatile statistic on the report. Since the numbers are so large, this is the one category in which I also present non-linear projections. All three projections say that we passed 14 million sometime last year.
The parabolic projection has no business being anywhere in a serious population model, because populations don't grow (or shrink) parabolically. But it's easy to calculate, and some years, just by sheer luck, it beats the other projections.
The exponential projection has been the best one for the past four years. This year, however, I'm betting that the linear projection will be the closest, although somewhat low.
Predicted total membership for 2010: 14,145,980 (an increase of 321,126).
___________________________________________________________
Increase in Children of Record
2005: 93,150
2006: 94,006
2007: 93,698
New Children of Record
2008: 123,502
2009: 119,722
2010: 129,608 (projected)
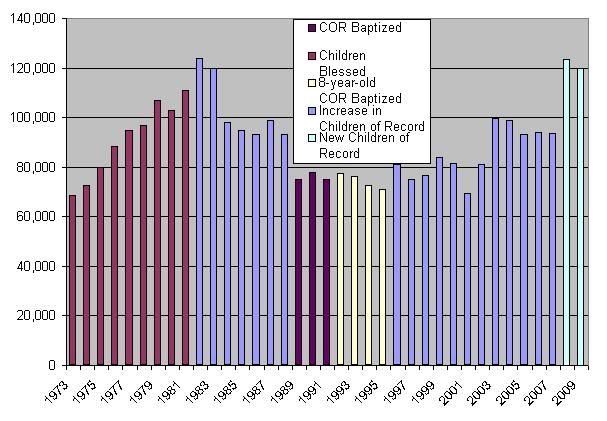
Those poor Church statisticians seem to have a lot of trouble getting all the kids to hold still long enough to be counted. As you can see, they have changed the name of the statistic several times (and with it apparently the counting methodology), and who's to say they won't do so again this year? Even when the name of the category was stable, the numbers often are not. So the projection is essentially meaningless, and this prediction is too.
Predicted new children of record for 2010: 117,833 (a decrease of 1,889).
___________________________________________________________
Converts Baptized
2005: 243,108
2006: 272,845
2007: 279,218
2008: 265,593
2009: 280,106
2010: 288,197 (projected)
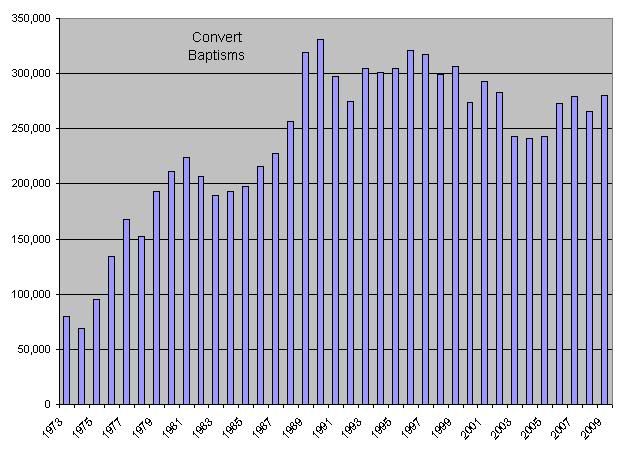
Convert baptisms had their strongest year since 2002 last year. The projection is for an even stronger year this time, but I'm going to guess that's high.
Predicted number of converts baptized for 2009: 282,763 (an increase of 2,657).
___________________________________________________________
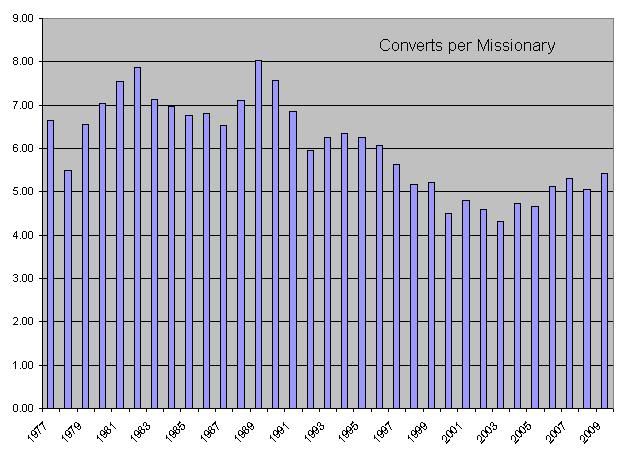
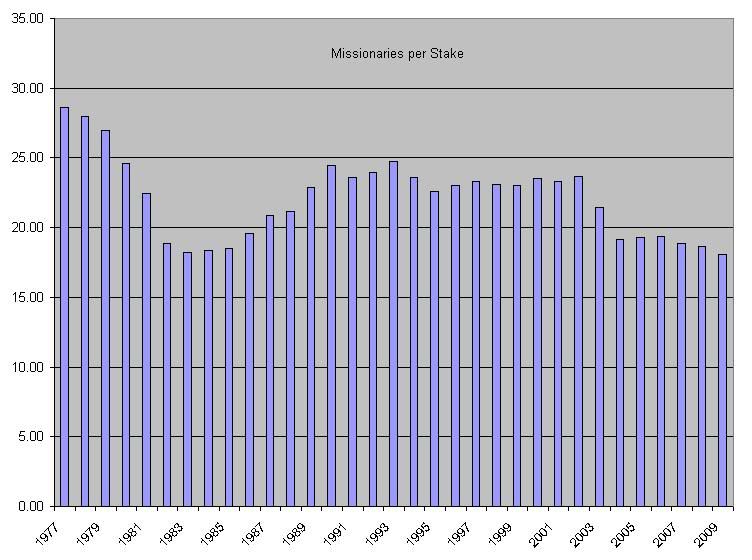
Full-time Missionaries
2005: 52,060
2006: 53,164
2007: 52,686
2008: 52,494
2009: 51,736
2010: 52,033 (projected)
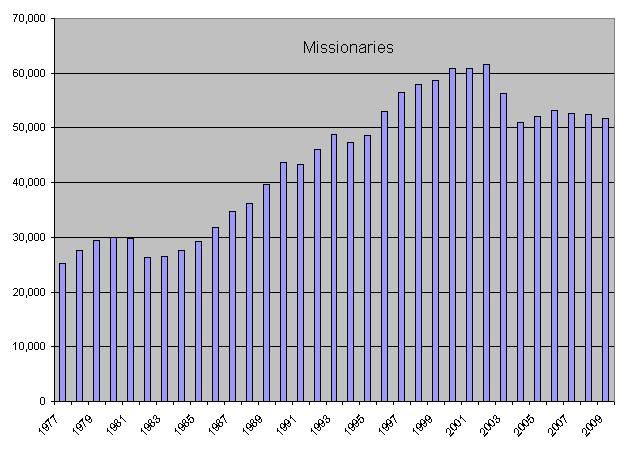
The number of missionaries has been trending downward since 2006. I think they're due for a an increase, and I'm guessing that they'll rebound even more than the projection.
Predicted number of full-time missionaries for 2010: 52,315 (an increase of 579).
___________________________________________________________
Happy handicapping!
(And thanks for the stable archive, Doc Shades.)
The first year I did this (2004), I posted my predictions at ZLMB. The next year, I posted them at the MAD board. The Wayback Machine archived 2005 for me, but all the subsequent years, up to and including last year, have been plowed under by MAD's latest incarnation, and archive.org never caught them. Therefore, I have come here hoping that this annual rite will have a more durable online presence.
My methodology is to calculate a projection by taking the previous five years' results for a particular statistic and seeing what the next year's value would be by linear projection. Then I eyeball it and decide whether that projection is likely to be high or low. For example:
Stakes
2005: 2,701
2006: 2,745
2007: 2,790
2008: 2,818
2009: 2,865
2010: 2,904 (five-year linear projection)
This projection can be calculated in Excel by using the TREND function. If the years 2005–2009 are in cells A1 through A5 and the stake totals are in cells B1 through B5, the 2010 projection can be calculated with this formula: TREND(B1:B5, A1:A5, 2010).
Here are the reported stake totals since 1973:
Last year stakes had, by a slim margin, their strongest year since the late 1990s. However, since the previous year was weaker than usual, I'm betting that the projection will be just a hair on the high side.
Predicted number of stakes for 2010: 2,903 (an increase of 38).
___________________________________________________________
Missions
2005: 341
2006: 344
2007: 348
2008: 348
2009: 344
2010: 348 (projected)
Last year the number of missions declined for the first time in eight years. I have the impression that the Church has been doing some global re-prioritizing of missionary resources recently, and I wouldn't be surprised if there's another decline in the offing. (Of course, I could have just paid attention to the Church News over the past year, but where's the fun in that?) In any case, I'm guessing the projection is high.
Predicted number of missions for 2010: 343 (a decrease of one).
___________________________________________________________
Districts
2005: 643
2006: 630
2007: 618
2008: 622
2009: 616
2010: 607 (projected)
Districts have mainly been declining for the last five years. I'm guessing that will continue, but not by as much as projected.
Predicted number of districts for 2010: 613 (a decrease of three).
___________________________________________________________
Wards and Branches
2005: 27,087
2006: 27,475
2007: 27,827
2008: 28,109
2009: 28,424
2010: 28,777 (projection)
Wards and branches have been increasing by about 1% to 1.5% a year. The projection is right about in the middle of that range, which I think is about right. Forced to pick a side, though, I'll say that the projection is high.
Predicted number of wards and branches for 2010: 28,763 (an increase of 339).
___________________________________________________________
Total Membership
2005: 12,560,869
2006: 12,868,606
2007: 13,193,999
2008: 13,508,509
2009: 13,824,854
2010: 14,141,729 (projected: linear)
2010: 14,156,268 (projected: parabolic)
2010: 14,169,235 (projected: exponential)
This is the largest and therefore least volatile statistic on the report. Since the numbers are so large, this is the one category in which I also present non-linear projections. All three projections say that we passed 14 million sometime last year.
The parabolic projection has no business being anywhere in a serious population model, because populations don't grow (or shrink) parabolically. But it's easy to calculate, and some years, just by sheer luck, it beats the other projections.
The exponential projection has been the best one for the past four years. This year, however, I'm betting that the linear projection will be the closest, although somewhat low.
Predicted total membership for 2010: 14,145,980 (an increase of 321,126).
___________________________________________________________
Increase in Children of Record
2005: 93,150
2006: 94,006
2007: 93,698
New Children of Record
2008: 123,502
2009: 119,722
2010: 129,608 (projected)
Those poor Church statisticians seem to have a lot of trouble getting all the kids to hold still long enough to be counted. As you can see, they have changed the name of the statistic several times (and with it apparently the counting methodology), and who's to say they won't do so again this year? Even when the name of the category was stable, the numbers often are not. So the projection is essentially meaningless, and this prediction is too.
Predicted new children of record for 2010: 117,833 (a decrease of 1,889).
___________________________________________________________
Converts Baptized
2005: 243,108
2006: 272,845
2007: 279,218
2008: 265,593
2009: 280,106
2010: 288,197 (projected)
Convert baptisms had their strongest year since 2002 last year. The projection is for an even stronger year this time, but I'm going to guess that's high.
Predicted number of converts baptized for 2009: 282,763 (an increase of 2,657).
___________________________________________________________
Full-time Missionaries
2005: 52,060
2006: 53,164
2007: 52,686
2008: 52,494
2009: 51,736
2010: 52,033 (projected)
The number of missionaries has been trending downward since 2006. I think they're due for a an increase, and I'm guessing that they'll rebound even more than the projection.
Predicted number of full-time missionaries for 2010: 52,315 (an increase of 579).
___________________________________________________________
Happy handicapping!
(And thanks for the stable archive, Doc Shades.)