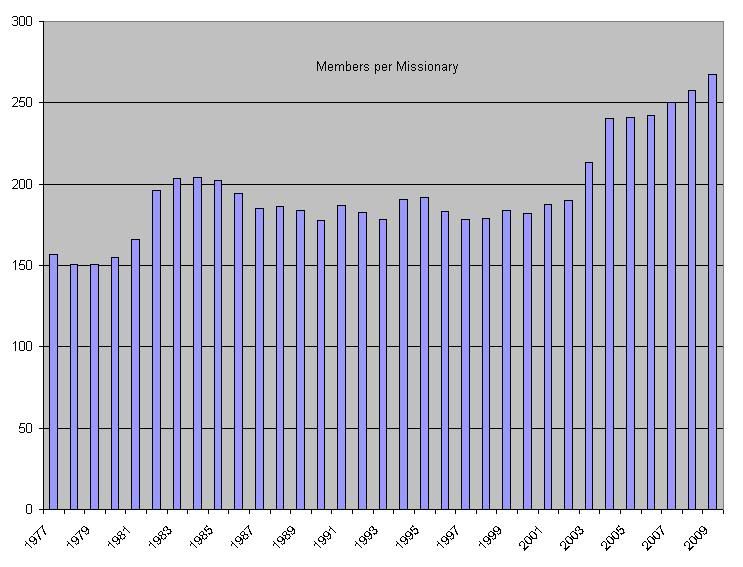
Handicapping the Statistical Report VII

The upper-crust forum for scholarly, polite, and respectful discussions only. Heavily moderated. Rated G.
_Alf O'Mega
_Emeritus
Posts: 127
Joined: Fri Jun 08, 2007 2:50 pm

Handicapping the Statistical Report VII

Post by _Alf O'Mega »

Here it is almost April, and the weather still feels like February, at least here in the northeast. (Stupid groundhog!) But regardless of spring's lack of springiness, it's time to peer into the crystal spreadsheet and take a shot at predicting the figures that will be reported this Saturday with General Conference's annual statistical report.

The first year I did this (2004), I posted my predictions at ZLMB. The next year, I posted them at the MAD board. The Wayback Machine archived 2005 for me, but all the subsequent years, up to and including last year, have been plowed under by MAD's latest incarnation, and archive.org never caught them. Therefore, I have come here hoping that this annual rite will have a more durable online presence.

My methodology is to calculate a projection by taking the previous five years' results for a particular statistic and seeing what the next year's value would be by linear projection. Then I eyeball it and decide whether that projection is likely to be high or low. For example:

Stakes
2005: 2,701
2006: 2,745
2007: 2,790
2008: 2,818
2009: 2,865
2010: 2,904 (five-year linear projection)

This projection can be calculated in Excel by using the TREND function. If the years 2005–2009 are in cells A1 through A5 and the stake totals are in cells B1 through B5, the 2010 projection can be calculated with this formula: TREND(B1:B5, A1:A5, 2010).

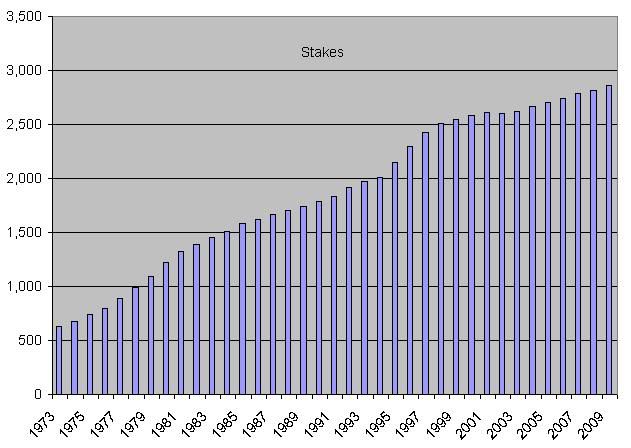
Here are the reported stake totals since 1973:
Image

Last year stakes had, by a slim margin, their strongest year since the late 1990s. However, since the previous year was weaker than usual, I'm betting that the projection will be just a hair on the high side.

Predicted number of stakes for 2010: 2,903 (an increase of 38).
___________________________________________________________

Missions
2005: 341
2006: 344
2007: 348
2008: 348
2009: 344
2010: 348 (projected)
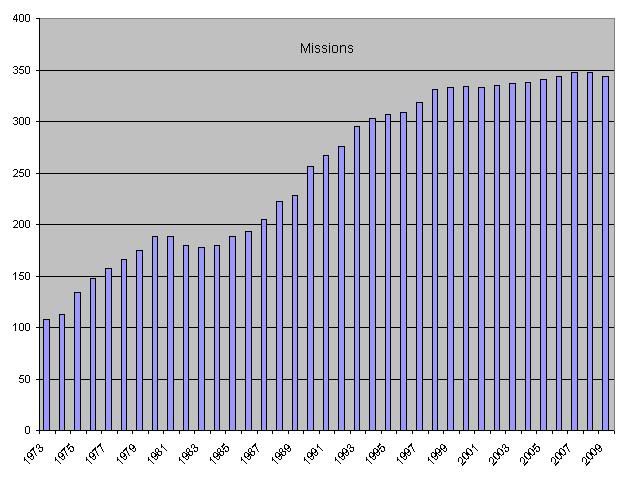
Image

Last year the number of missions declined for the first time in eight years. I have the impression that the Church has been doing some global re-prioritizing of missionary resources recently, and I wouldn't be surprised if there's another decline in the offing. (Of course, I could have just paid attention to the Church News over the past year, but where's the fun in that?) In any case, I'm guessing the projection is high.

Predicted number of missions for 2010: 343 (a decrease of one).
___________________________________________________________

Districts
2005: 643
2006: 630
2007: 618
2008: 622
2009: 616
2010: 607 (projected)
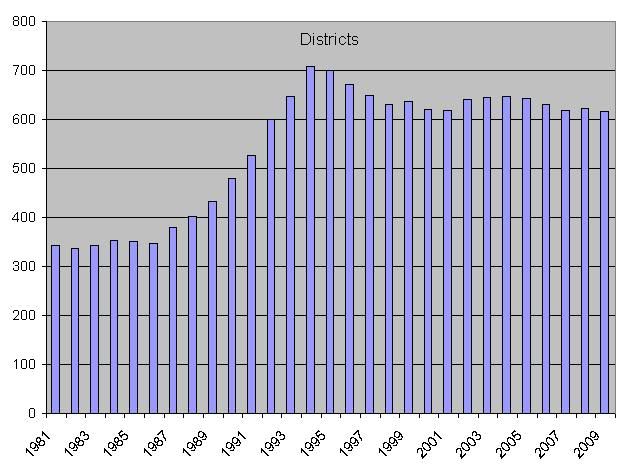
Image

Districts have mainly been declining for the last five years. I'm guessing that will continue, but not by as much as projected.

Predicted number of districts for 2010: 613 (a decrease of three).
___________________________________________________________

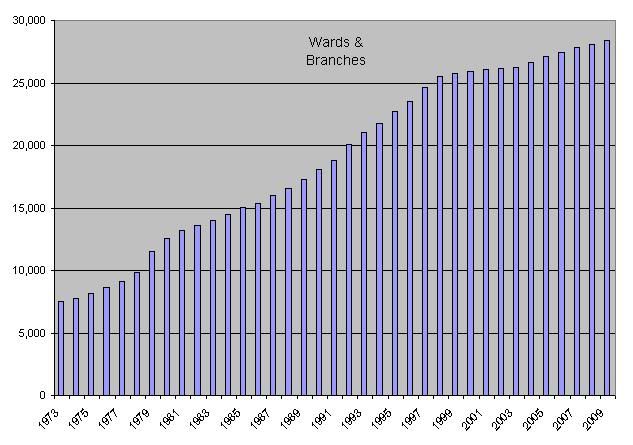
Wards and Branches
2005: 27,087
2006: 27,475
2007: 27,827
2008: 28,109
2009: 28,424
2010: 28,777 (projection)
Image

Wards and branches have been increasing by about 1% to 1.5% a year. The projection is right about in the middle of that range, which I think is about right. Forced to pick a side, though, I'll say that the projection is high.

Predicted number of wards and branches for 2010: 28,763 (an increase of 339).
___________________________________________________________

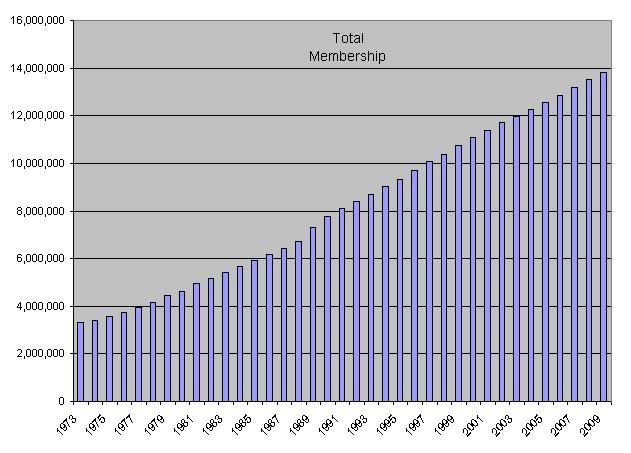
Total Membership
2005: 12,560,869
2006: 12,868,606
2007: 13,193,999
2008: 13,508,509
2009: 13,824,854
2010: 14,141,729 (projected: linear)
2010: 14,156,268 (projected: parabolic)
2010: 14,169,235 (projected: exponential)
Image

This is the largest and therefore least volatile statistic on the report. Since the numbers are so large, this is the one category in which I also present non-linear projections. All three projections say that we passed 14 million sometime last year.

The parabolic projection has no business being anywhere in a serious population model, because populations don't grow (or shrink) parabolically. But it's easy to calculate, and some years, just by sheer luck, it beats the other projections.

The exponential projection has been the best one for the past four years. This year, however, I'm betting that the linear projection will be the closest, although somewhat low.

Predicted total membership for 2010: 14,145,980 (an increase of 321,126).
___________________________________________________________

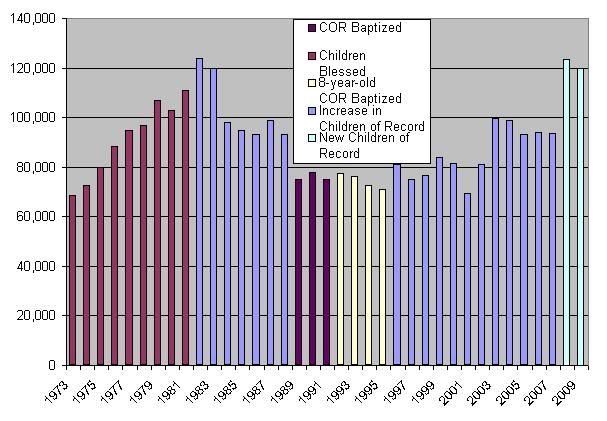
Increase in Children of Record
2005: 93,150
2006: 94,006
2007: 93,698

New Children of Record
2008: 123,502
2009: 119,722
2010: 129,608 (projected)
Image

Those poor Church statisticians seem to have a lot of trouble getting all the kids to hold still long enough to be counted. As you can see, they have changed the name of the statistic several times (and with it apparently the counting methodology), and who's to say they won't do so again this year? Even when the name of the category was stable, the numbers often are not. So the projection is essentially meaningless, and this prediction is too.

Predicted new children of record for 2010: 117,833 (a decrease of 1,889).
___________________________________________________________

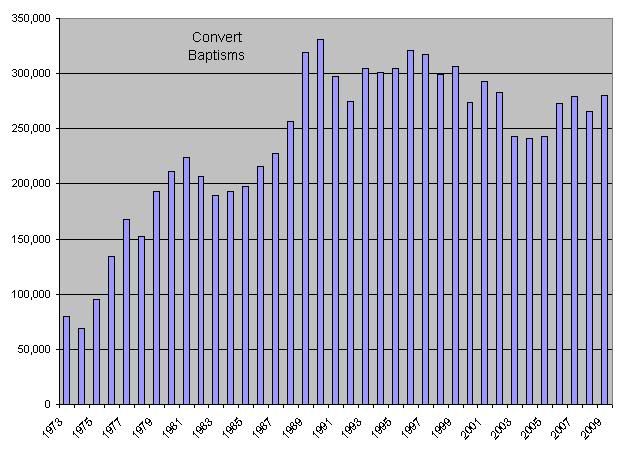
Converts Baptized
2005: 243,108
2006: 272,845
2007: 279,218
2008: 265,593
2009: 280,106
2010: 288,197 (projected)
Image

Convert baptisms had their strongest year since 2002 last year. The projection is for an even stronger year this time, but I'm going to guess that's high.

Predicted number of converts baptized for 2009: 282,763 (an increase of 2,657).
___________________________________________________________

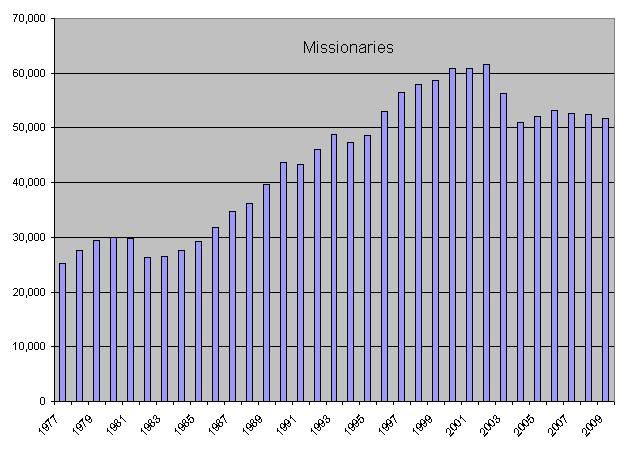
Full-time Missionaries
2005: 52,060
2006: 53,164
2007: 52,686
2008: 52,494
2009: 51,736
2010: 52,033 (projected)
Image

The number of missionaries has been trending downward since 2006. I think they're due for a an increase, and I'm guessing that they'll rebound even more than the projection.

Predicted number of full-time missionaries for 2010: 52,315 (an increase of 579).
___________________________________________________________

Happy handicapping!

(And thanks for the stable archive, Doc Shades.)
Last edited by Guest on Fri Apr 01, 2011 4:16 am, edited 3 times in total.
_Alf O'Mega
_Emeritus
Posts: 127
Joined: Fri Jun 08, 2007 2:50 pm

Re: Handicapping the Statistical Report VII

Post by _Alf O'Mega »

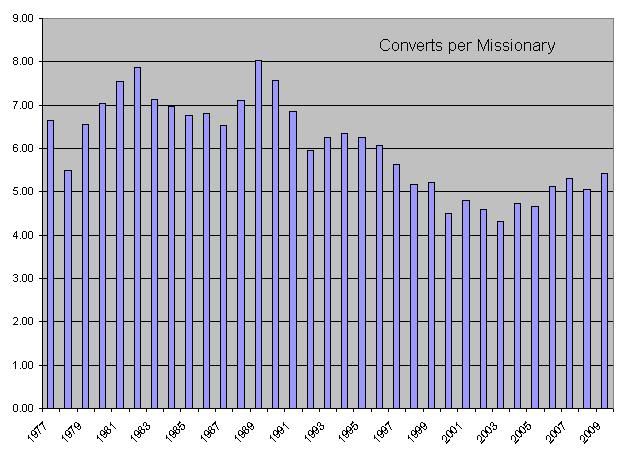
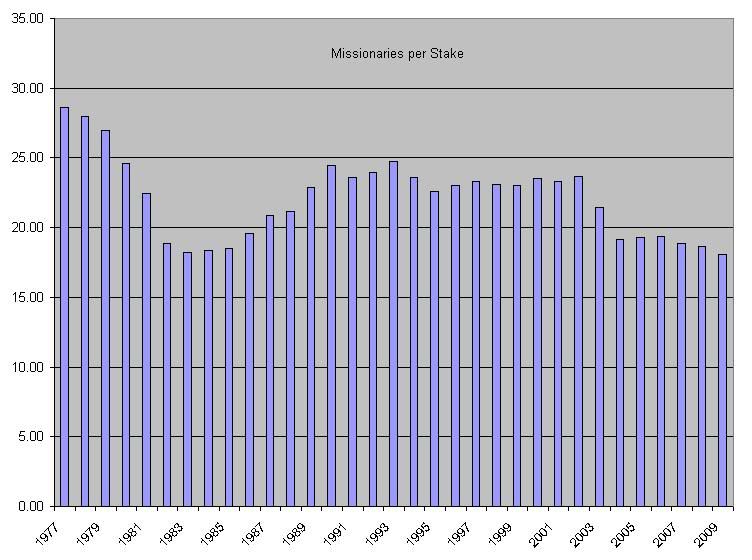
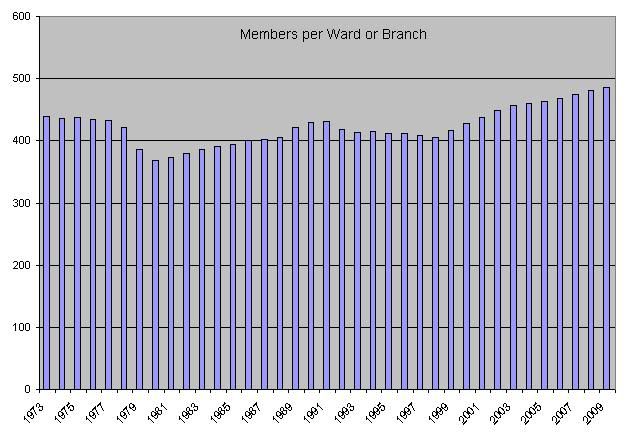
Here are some bonus charts:

Image

Image

Image

Image

Image

Image

Image

Image

Image

Image

Image
_LDSToronto
_Emeritus
Posts: 2515
Joined: Sat Jan 01, 2011 2:11 am

Re: Handicapping the Statistical Report VII

Post by _LDSToronto »

Nice work, Alf - I'm a bit of a geek for this stuff, too. I have a couple of questions, if you don't mind...

Alf O'Mega wrote:Here are some bonus charts:
Image

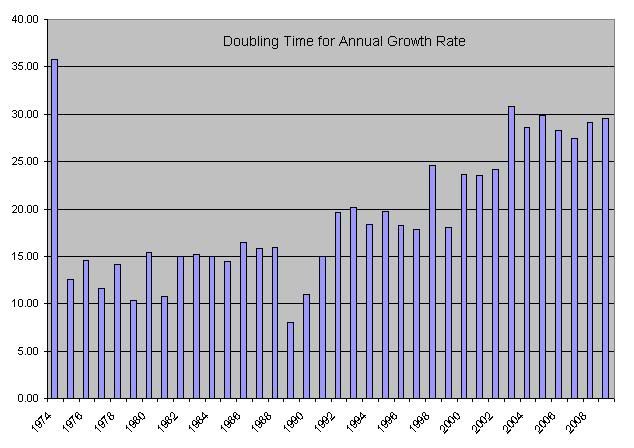
Would you mind explaining what this graph means?

Alf O'Mega wrote:Here are some bonus charts:
Image

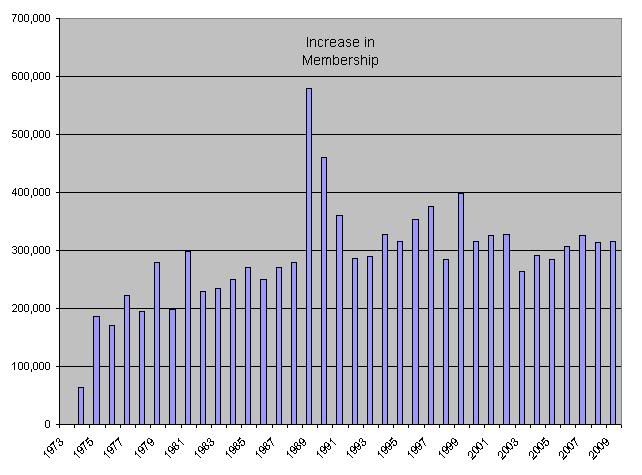
How did you calculate this graph?

Thanks,
H.
"Others cannot endure their own littleness unless they can translate it into meaningfulness on the largest possible level."
~ Ernest Becker
"Whether you think of it as heavenly or as earthly, if you love life immortality is no consolation for death."
~ Simone de Beauvoir
_Fifth Columnist
_Emeritus
Posts: 396
Joined: Fri Nov 26, 2010 7:08 pm

Re: Handicapping the Statistical Report VII

Post by _Fifth Columnist »

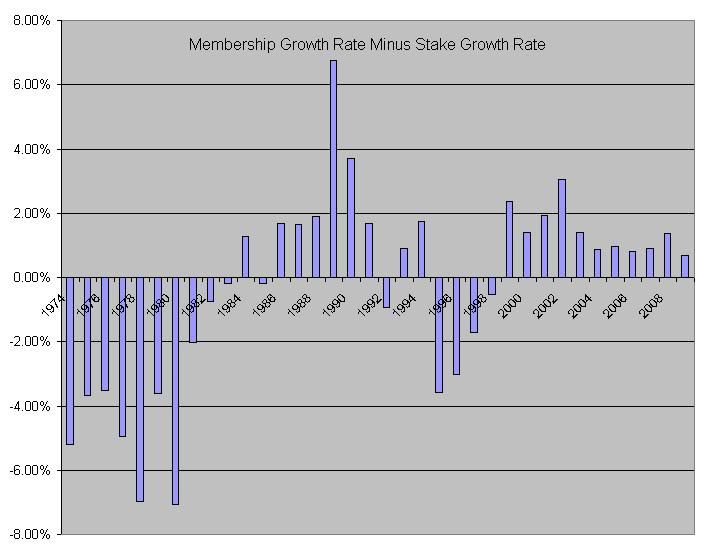
Image

Image

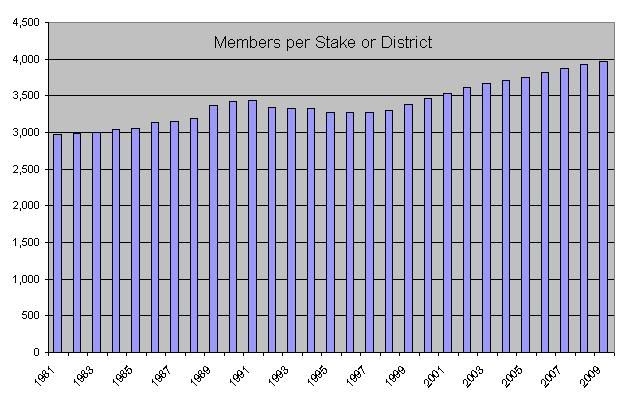
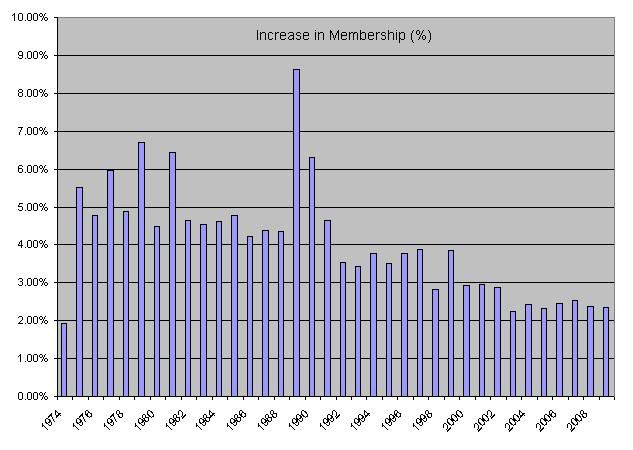
These two charts seem to show that a larger percentage of the membership is going inactive and the inflection point seems to be around 1999. Could this be due to the rise of the Internet?
_Themis
_Emeritus
Posts: 13426
Joined: Wed Feb 17, 2010 6:43 pm

Re: Handicapping the Statistical Report VII

Post by _Themis »

LDSToronto wrote:Nice work, Alf - I'm a bit of a geek for this stuff, too. I have a couple of questions, if you don't mind...

Alf O'Mega wrote:Here are some bonus charts:
Image

Would you mind explaining what this graph means?


That is the number of years it will take for the overall membership to double based on each years % growth rates. The doubling would be based on if the growth rate on a particular year remained constant each year.


Alf O'Mega wrote:Here are some bonus charts:
Image

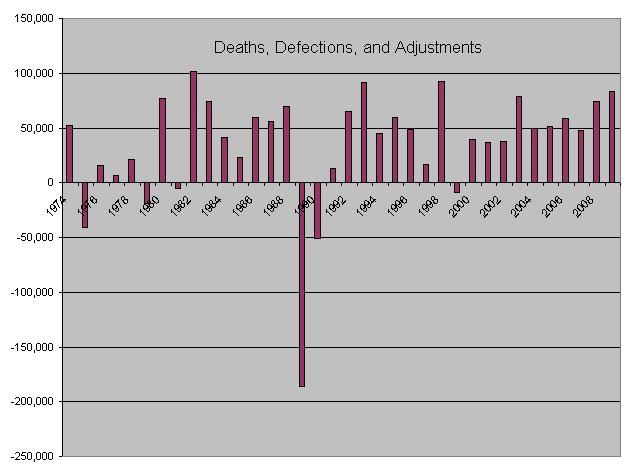
How did you calculate this graph?

Thanks,
H.


I believe this is based on taking the previous years total membership adding the current years convert baptisms and children of record and taking that total and subtracting the current years total membership. This would give you the number of those who died or were taken off the membership list. I am not sure if they actually stop counting those who have had their memberships removed or have been excommunicated. The number looks to be to low for that. I read soemthing that took into account how many usually die in a given year that showed the numbers they have probably only include those who have died. Unfortunately I cannot remember where I read that, so maybe someone else may know what I am talking about.
42
_Alf O'Mega
_Emeritus
Posts: 127
Joined: Fri Jun 08, 2007 2:50 pm

Re: Handicapping the Statistical Report VII

Post by _Alf O'Mega »

The doubling time graph represents the time that the population would take to double given that year's growth rate. For 2009, the doubling time is 29.6 years. I calculated this by taking the growth rate for 2009 ([13,824,854 - 13,508,509] / 13,508,509 = 2.34%) and dividing it into the natural log of 2 (~.6931).

Deaths, defections, and adjustments are calculated by adding the number of convert baptisms to the new children of record and subtracting the increase in the total membership. In years where this number is negative (most recently 1999), we know that there was some adjustment to the total for some other reason than regular growth. It could be adding some leftover numbers from an earlier year that were not previously accounted for. Most likely the enormous adjustments of 1989 and 1990 correspond with the implementation of a new policy to leave people whom they have lost track of on the records until 110 years after their birth or until they receive confirmation of death.
_Themis
_Emeritus
Posts: 13426
Joined: Wed Feb 17, 2010 6:43 pm

Re: Handicapping the Statistical Report VII

Post by _Themis »

Fifth Columnist wrote:
These two charts seem to show that a larger percentage of the membership is going inactive and the inflection point seems to be around 1999. Could this be due to the rise of the Internet?


I would say yes, but it is a guess. It may be a little complicated to figure out. Many here seem to indicate they could not have gotten the information they needed other then from the internet. What happens though when a number of people find out through the internet about the church and then start to spread that information over the rest of their life to other members they know. I would also want to look at what affect the increasing secularization of society has on the church as well.

Also I know many members would love to see Romney win the nominations to run for President. I don't think they understand, due to lack of knowledge, what kind of effect that would have on the church. It would put even more media attention on the church and you can be sure they would be bringing up a lot of information that most members never knew about. What can make that worse is when they start saying to other members it is just lies some of them who know better may actually correct them.
42
_LDSToronto
_Emeritus
Posts: 2515
Joined: Sat Jan 01, 2011 2:11 am

Re: Handicapping the Statistical Report VII

Post by _LDSToronto »

Alf O'Mega wrote:The doubling time graph represents the time that the population would take to double given that year's growth rate. For 2009, the doubling time is 29.6 years. I calculated this by taking the growth rate for 2009 ([13,824,854 - 13,508,509] / 13,508,509 = 2.34%) and dividing it into the natural log of 2 (~.6931).

Deaths, defections, and adjustments are calculated by adding the number of convert baptisms to the new children of record and subtracting the increase in the total membership. In years where this number is negative (most recently 1999), we know that there was some adjustment to the total for some other reason than regular growth. It could be adding some leftover numbers from an earlier year that were not previously accounted for. Most likely the enormous adjustments of 1989 and 1990 correspond with the implementation of a new policy to leave people whom they have lost track of on the records until 110 years after their birth or until they receive confirmation of death.

Thanks, Alf. Do you post your raw data anywhere? It would be interesting to play around with it and the google trend tool to find correlations in growth, and also to compare it to my own stake data.

H.
"Others cannot endure their own littleness unless they can translate it into meaningfulness on the largest possible level."
~ Ernest Becker
"Whether you think of it as heavenly or as earthly, if you love life immortality is no consolation for death."
~ Simone de Beauvoir
_Alf O'Mega
_Emeritus
Posts: 127
Joined: Fri Jun 08, 2007 2:50 pm

Re: Handicapping the Statistical Report VII

Post by _Alf O'Mega »

LDSToronto wrote:Thanks, Alf. Do you post your raw data anywhere? It would be interesting to play around with it and the google trend tool to find correlations in growth, and also to compare it to my own stake data.

I just typed it all in from the conference issues of the Ensign available at LDS.org. I don't recommend opening Excel files from strangers, but here is the raw data since 1973:

Year Stakes
1973 630
1974 675
1975 737
1976 798
1977 885
1978 990
1979 1,092
1980 1,218
1981 1,321
1982 1,392
1983 1,458
1984 1,507
1985 1,582
1986 1,622
1987 1,666
1988 1,707
1989 1,739
1990 1,784
1991 1,837
1992 1,919
1993 1,968
1994 2,008
1995 2,150
1996 2,296
1997 2,424
1998 2,505
1999 2,542
2000 2,581
2001 2,607
2002 2,602
2003 2,624
2004 2,665
2005 2,701
2006 2,745
2007 2,790
2008 2,818
2009 2,865

Year Missions
1973 108
1974 113
1975 134
1976 148
1977 157
1978 166
1979 175
1980 188
1981 188
1982 180
1983 178
1984 180
1985 188
1986 193
1987 205
1988 222
1989 228
1990 256
1991 267
1992 276
1993 295
1994 303
1995 307
1996 309
1997 318
1998 331
1999 333
2000 334
2001 333
2002 335
2003 337
2004 338
2005 341
2006 344
2007 348
2008 348
2009 344

Year Districts
1981 342
1982 336
1983 343
1984 353
1985 352
1986 346
1987 379
1988 402
1989 432
1990 479
1991 527
1992 601
1993 647
1994 709
1995 699
1996 671
1997 649
1998 631
1999 636
2000 621
2001 618
2002 641
2003 644
2004 646
2005 643
2006 630
2007 618
2008 622
2009 616

Year Wards & Branches
1990 18,090
1991 18,810
1992 20,081
1993 21,002
1994 21,774
1995 22,697
1996 23,528
1997 24,670
1998 25,551
1999 25,793
2000 25,915
2001 26,084
2002 26,143
2003 26,237
2004 26,670
2005 27,087
2006 27,475
2007 27,827
2008 28,109
2009 28,424

Year Wards
1973 4,580
1974 4,756
1975 5,095
1976 5,481
1977 5,917
1978 6,731
1979 7,235
1980 7,868
1981 8,392
1982 8,888
1983 9,329
1984 9,723
1985 10,168
1986 10,527
1987 10,907
1988 11,196
1989 11,536

Year Branches
1989 5,769

Year Branches in stakes
1973 1,127
1974 1,195
1975 1,295
1976 1,422
1977 1,549
1978 1,333
1979 2,130
1980 2,456
1981 2,719
1982 2,699
1983 2,641
1984 2,697
1985 2,766
1986 2,792
1987 2,812
1988 2,899

Year Branches in missions
1973 1,847
1974 1,822
1975 1,761
1976 1,716
1977 1,694
1978 1,790
1979 2,121
1980 2,267
1981 2,102
1982 2,029
1983 2,024
1984 2,043
1985 2,071
1986 2,070
1987 2,287
1988 2,463

Year Total Membership
1973 3,321,556
1974 3,385,909
1975 3,572,202
1976 3,742,749
1977 3,966,000
1978 4,160,000
1979 4,439,000
1980 4,638,000
1981 4,936,000
1982 5,165,000
1983 5,400,000
1984 5,650,000
1985 5,920,000
1986 6,170,000
1987 6,440,000
1988 6,720,000
1989 7,300,000
1990 7,760,000
1991 8,120,000
1992 8,406,895
1993 8,696,224
1994 9,024,569
1995 9,340,898
1996 9,694,549
1997 10,070,524
1998 10,354,241
1999 10,752,986
2000 11,068,861
2001 11,394,522
2002 11,721,548
2003 11,985,254
2004 12,275,822
2005 12,560,869
2006 12,868,606
2007 13,193,999
2008 13,508,509
2009 13,824,854

Year Children Blessed
1973 68,623
1974 72,717
1975 79,723
1976 88,522
1977 95,000
1978 97,000
1979 107,000
1980 103,000
1981 111,000

Year Children of Record Baptized
1973 48,578
1974 47,234
1975 50,263
1976 52,281
1977 62,000
1978 63,000
1979 67,000
1980 65,000
1981 69,000
1982 67,000
1983 69,000
1984 69,000
1985 70,000
1986 72,000
1987 75,000
1988 73,000
1989 75,000
1990 78,000
1991 75,000

Year Increase in Children of Record
1982 124,000
1983 120,000
1984 98,000
1985 95,000
1986 93,000
1987 99,000
1988 93,000
1996 81,017
1997 75,214
1998 76,829
1999 84,118
2000 81,450
2001 69,522
2002 81,132
2003 99,457
2004 98,870
2005 93,150
2006 94,006
2007 93,698

Year 8-year-old Children of Record Baptized
1992 77,380
1993 76,312
1994 72,538
1995 71,139

Year New Children of Record
2008 123,502
2009 119,722

Year Convert Baptisms
1973 79,603
1974 69,018
1975 95,412
1976 133,959
1977 167,939
1978 152,000
1979 193,000
1980 211,000
1981 224,000
1982 207,000
1983 189,419
1984 192,983
1985 197,640
1986 216,210
1987 227,284
1988 256,515
1989 318,940
1990 330,877
1991 297,770
1992 274,477
1993 304,808
1994 300,730
1995 304,330
1996 321,385
1997 317,798
1998 299,134
1999 306,171
2000 273,973
2001 292,612
2002 283,138
2003 242,923
2004 241,239
2005 243,108
2006 272,845
2007 279,218
2008 265,593
2009 280,106

Year Missionaries
1977 25,300
1978 27,669
1979 29,454
1980 29,953
1981 29,700
1982 26,300
1983 26,565
1984 27,655
1985 29,265
1986 31,803
1987 34,750
1988 36,132
1989 39,739
1990 43,651
1991 43,395
1992 46,025
1993 48,708
1994 47,311
1995 48,631
1996 52,938
1997 56,531
1998 57,853
1999 58,593
2000 60,784
2001 60,850
2002 61,638
2003 56,237
2004 51,067
2005 52,060
2006 53,164
2007 52,686
2008 52,494
2009 51,736
_harmony
_Emeritus
Posts: 18195
Joined: Fri Oct 27, 2006 1:35 am

Re: Handicapping the Statistical Report VII

Post by _harmony »

What happened in 1989?
(Nevo, Jan 23) And the Melchizedek Priesthood may not have been restored until the summer of 1830, several months after the organization of the Church.
Post Reply